

The Franchise KPIs That Actually Predict Success
Track nine numbers weekly: gross sales, same-store growth, EBITDA margin, average ticket, labor % of sales, COGS %, customer acquisition cost, NPS or retention, and training completion or audit score. The single best move you can make this week is building a scorecard that combines one financial number, one growth number, and one operational leading indicator, because franchises tracking five or more metrics grow revenue roughly 2.3 times faster than those that only glance at monthly sales reports.
- Revenue: gross sales, revenue per location, same-store sales growth
- Profitability: net profit/EBITDA margin, average ticket, transaction count
- Customer health: NPS, retention rate, customer count
- Cost control: labor % of sales, COGS %
- Growth engine: CAC, LTV, marketing ROI
- Compliance: training completion rate, audit score, SOP compliance
Key Takeaways
Franchise KPIs work only when financial, operational, and customer metrics are tracked together on a consistent cadence with a clear owner assigned to each number.
| Point | Details |
|---|---|
| Track a balanced set | Combine revenue, EBITDA margin, and one leading operational indicator on a weekly scorecard. |
| Watch leading indicators | Training completion and audit scores can flag revenue problems 60 to 90 days before they hit the P&L. |
| Use category benchmarks | Compare EBITDA margin and break-even timelines against your specific vertical, not franchising broadly. |
| Treat satisfaction as ongoing | Review NPS and franchisee satisfaction monthly instead of filing an annual survey away. |
| Separate system and unit views | Track system-wide averages and individual franchisee performance side by side, never as a substitute for the other. |
Franchise KPIs Every Owner Should Track and How to Calculate Them
Most franchise scorecards drown in vanity numbers. The ones that matter fall into four buckets: revenue, profitability, customer behavior, and operations. Here’s how to compute and read each one.
- Gross sales and revenue by location. Add total sales per unit for the period. Compare each location against the system average; a variance of more than 15% below average signals either a market problem or an execution gap worth a site visit.
- Same-store sales growth. Compare this year’s sales to last year’s for units open at least 12 months, which strips out the noise from new openings. Normalize for seasonality by comparing rolling 12-month periods, not single months.
- Net profit / EBITDA and owner earnings. EBITDA equals revenue minus operating expenses before interest, tax, depreciation, and amortization. This differs from royalty, which is a flat percentage franchisors collect regardless of your margin. A location can hit sales targets and still lose money if EBITDA margin is thin. Frangelic’s breakdown of unit economics walks through the full calculation.
- Average ticket and transaction count. Divide revenue by number of transactions. Restaurants should also watch RevPASH (revenue per available seat hour) to catch underused capacity during slow dayparts.
- NPS and retention. Survey customers quarterly at minimum, monthly if you have the volume. Franchise Business Review’s research across 330 brands found franchisee and customer satisfaction predict revenue shifts weeks before they show up on a P&L.
- Marketing KPIs. CAC (total marketing spend divided by new customers acquired) should sit well below your average customer’s lifetime value (LTV). A common rule of thumb targets an LTV to CAC ratio of at least 3:1.
- Expense KPIs. Labor typically runs 25 to 35% of sales in food service and 20 to 30% in home services. COGS above 30% in QSR usually points to portioning waste or vendor pricing problems.
- Operational KPIs. Training completion rate, audit/compliance score, corrective action closure rate, and employee turnover round out the leading indicators that catch trouble before it hits revenue.
Pro Tip: Don’t just track NPS once a year in a satisfaction survey. Brands that treat it as an ongoing management input, reviewed monthly alongside sales, see stronger franchisee buy-in and better marketing performance than brands that file it away as an annual report card.
How Do Financial, Operational, and Customer KPIs Connect?
Revenue minus variable costs equals contribution margin. Subtract fixed costs and you land on EBITDA, which is the number that actually tells you whether a franchise is viable, not gross sales. A location can post strong top-line numbers and still struggle if royalty and fixed overhead eat into thin margins, which is why owner earnings deserve more attention than the sales figure printed on Item 19 disclosures.
The KPI groups feed into each other in ways that make diagnosis faster once you know the pattern.
- Operational leading indicators like training completion and audit scores tend to predict revenue drops 60 to 90 days before they show up in the numbers, giving you a window to intervene.
- Customer satisfaction and retention directly affect CAC. A location with poor NPS spends more to replace churned customers, which drags down LTV and inflates acquisition cost.
- Franchisee trust in leadership correlates with better collaboration on local marketing, which is part of why top-performing brands outperform lower-ranked ones by 67% to 100% on core performance benchmarks.
Use this as a diagnostic shortcut: if margin is falling but sales are holding steady, the problem usually lives in COGS or labor, not demand. If sales are falling alongside declining NPS scores, the issue is more likely operational execution or a marketing message that’s stopped resonating with the local market. Chasing the wrong lever wastes months.
How Do You Set Realistic KPI Targets and Benchmarks?
Start with a clean baseline before comparing yourself to anyone else.
- Pick a baseline period. Use trailing 12 months where possible, and exclude the first 6 to 12 months after a grand opening, since new units rarely reflect steady-state performance.
- Set layered targets. Weekly and monthly targets should track operating levers you control directly, like labor % and transaction count. Quarterly targets should track lagging outcomes like EBITDA margin and same-store growth.
- Apply category benchmarks. Compare your numbers against your specific vertical, not franchising broadly.
| Category | EBITDA margin range | Typical break-even timeline |
|---|---|---|
| Quick-service restaurants | 12% to 20% | about three years |
| Home services | 15% to 25% | 6 to 15 months |
| Fitness | Varies by membership model | Attrition-dependent |
These ranges come from category benchmark research covering QSR, home services, and fitness concepts. A healthy franchise generally aims to recoup its investment within about three years, an investment-to-earnings ratio near 3:1, and home services concepts frequently beat that pace.
Building a Weekly Scorecard and Deciding Who Owns It
Set a rhythm: daily sales checks, a weekly KPI pulse across the full scorecard, a monthly deep-dive with each franchisee, and a quarterly benchmark review against category data.
Your minimal scorecard needs these columns, updated weekly:
- Date, revenue, same-store %
- EBITDA margin, labor %, COGS %
- NPS, training completion %
- Corrective action status and owner-assigned next step
Automate feeds from your POS, payroll, and CRM systems wherever possible so the scorecard populates itself instead of eating an afternoon every Monday. Brands that track corrective-action closure resolve compliance issues roughly 40% faster than those that let items sit open indefinitely.
Pro Tip: Keep the weekly report to one page. Send the full scorecard to the franchisee and a summarized version, flagging only red and yellow metrics, to the HQ regional support team. Nobody reads a ten-tab spreadsheet consistently.
The Frangelic Playbook for Turning KPIs Into Growth
Colby built Frangelic’s coaching system after two decades watching franchisees drown in dashboards nobody used. The fix isn’t more data. It’s a sequence:
- Define the 8 to 10 KPIs that matter for your concept
- Baseline against category benchmarks before setting targets
- Implement a weekly scorecard with clear ownership
- Layer in coaching cadence tied to the metrics that are lagging
- Measure improvement monthly and adjust the plan
One Frangelic client cut labor cost as a percentage of sales by several points within a single quarter, simply by pairing weekly scorecard reviews with targeted coaching on scheduling and shift accountability.
If you want a guided rollout instead of building this alone, Frangelic’s franchise rollout plan is the starting template.
Why Franchisee Satisfaction and Engagement Belong on Your Scorecard
Franchisee satisfaction is not a soft metric you check once a year for the annual convention survey. It’s a leading indicator with real predictive power. Franchise Business Review’s research found that satisfaction can foreshadow revenue movement up to 60 days before it appears on a P&L, which means a satisfaction dip deserves the same urgency as a sales dip.

Measure it through structured surveys covering trust in leadership, quality of field support, marketing fund transparency, and perceived fairness of territory decisions. Run these at least twice a year, ideally quarterly if your system is large enough to justify the cadence. Track two numbers specifically: overall satisfaction score and likelihood-to-recommend, since brands where franchisees actively recommend joining tend to have stronger unit economics across the board.
Engagement shows up in behavior, not just survey answers. Watch attendance at optional training sessions, participation in local co-op marketing, and how quickly franchisees respond to corporate communications. A franchisee who skips every optional call and ignores emails is usually the same one whose location shows up red on your scorecard a few months later. Treating satisfaction as an ongoing management input, not a once-a-year report card, is what separates brands that outperform peers by wide margins from those that just collect the data and file it away.
System-Wide KPIs vs. Individual Franchisee KPIs
A franchisor and a franchisee are looking at the same business through different lenses, and conflating the two views leads to bad decisions on both sides.
System-wide KPIs answer questions about the brand as a portfolio: total system sales, average unit volume across the network, franchisee satisfaction aggregated across all locations, unit growth rate, and closure or transfer rate. These numbers tell a franchisor whether the model is healthy enough to keep selling and whether support programs are working across diverse markets.
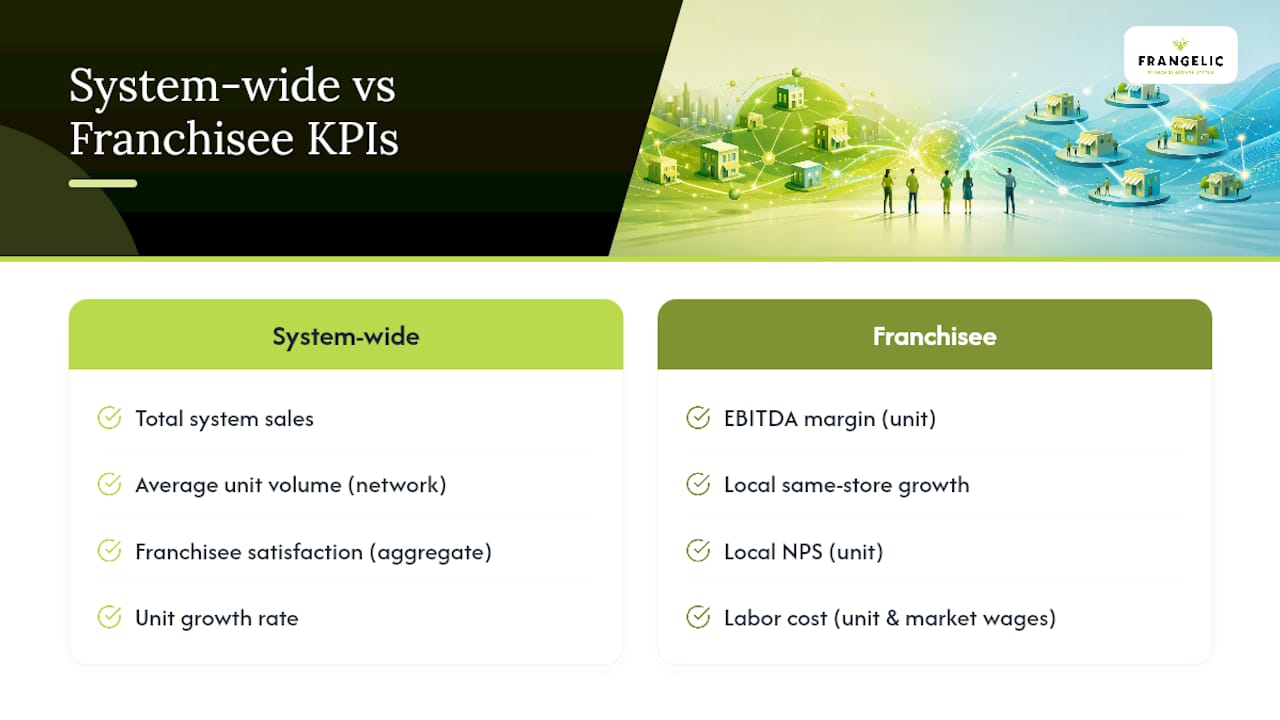
Individual franchisee KPIs answer a narrower, more personal question: is this specific location profitable and improving? That means EBITDA margin, local same-store growth, local NPS, and labor cost specific to that unit’s staffing and market wage rates.
The disconnect happens when a franchisor celebrates strong system-wide average unit volume while a chunk of underperforming locations quietly struggle. Averages hide outliers. A franchisor tracking only aggregate numbers can miss that the bottom quartile of units is bleeding cash even as the system total looks healthy. Franchisees, meanwhile, sometimes fixate on their own numbers without benchmarking against the system average, missing whether their struggles are local execution issues or a brand-wide problem in the making. Both views need to run side by side, not as a substitute for each other.
Lead Generation and Conversion Rates for Franchise Sales
Franchise development teams need their own KPI set, separate from unit-level operations, because selling franchises is a distinct funnel with its own bottlenecks.
Track cost per lead, lead-to-discovery-day conversion rate, discovery-day-to-signed-agreement conversion rate, and total cost to award a new franchise. A healthy funnel typically sees a meaningful drop-off at each stage, so the real diagnostic value comes from watching where your conversion rate lags behind your own historical average, not chasing an arbitrary industry number.
If cost per lead is climbing while conversion rates hold steady, the issue is usually media spend efficiency, not the sales process. If lead volume is fine but discovery-day conversion is falling, that points to a weaker sales presentation or a mismatch between the leads your marketing attracts and the franchisee profile your validation calls actually convert. Track time-to-close as well. A funnel that takes twice as long to close a deal ties up sales team capacity and often signals unclear qualification criteria earlier in the process. Franchise development KPIs deserve their own dashboard, reviewed separately from operational scorecards, because the people accountable for each are usually different teams with different levers to pull.
Renewal, Termination, and Transfer KPIs You Can’t Ignore
Renewal rate is one of the most honest KPIs a franchise system has, because it reflects a franchisee’s decision made with years of firsthand experience rather than a survey response. Track the percentage of franchise agreements renewed at term versus those that lapse or transfer, and segment by cohort year to spot whether a particular vintage of franchisees is struggling more than others.
Termination rate needs closer scrutiny than most systems give it. A rising involuntary termination rate, especially tied to specific violations like brand standards or royalty non-payment, often signals a support gap rather than a string of bad franchisee hires. Voluntary terminations and buyouts deserve a root-cause review, since exit interviews frequently surface operational or financial stress that showed up in the KPI data months earlier if anyone had been watching.
Transfer rate, meaning how often units change ownership rather than close outright, is actually a healthier signal than it sounds. A functioning resale market suggests the business model retains value even when an individual owner wants out. Track average time-on-market for a transfer and the price-to-revenue ratio buyers are willing to pay, since a shrinking multiple over time is an early warning that system confidence is eroding even before renewal numbers start slipping.
Cash Flow Metrics Every Franchise Operator Needs
Profitable on paper and solvent in the bank account are two different conditions, and franchise operators get burned more often by the second one. Track operating cash flow separately from net income, since royalty payments, marketing fund contributions, and equipment lease payments can all drain cash even when the P&L shows a profit.

Days cash on hand tells you how many days you could operate if revenue stopped tomorrow. Most healthy franchise locations should carry at least 30 to 45 days of operating expenses in reserve. Watch accounts receivable turnover if your concept involves any commercial or contract-based billing, since slow-paying commercial clients in home services or B2B franchise models can quietly starve an otherwise profitable business of working capital.
Capital expenditure timing matters more in franchising than most independent businesses realize, because franchise agreements often mandate remodels or equipment refreshes on a fixed schedule regardless of your current cash position. Track your capex reserve fund separately and build it steadily rather than scrambling when a mandated remodel notice arrives. A field-service benchmarking resource like TradePilot can help home-services operators model cash flow specifically around technician utilization and job scheduling, where revenue timing tends to be lumpier than retail or restaurant concepts.
Sources
Validate your targets against Franchise Business Review’s satisfaction research, category benchmarks from VetMyFranchise, and the U.S. Census overview of franchising. For templates, see Frangelic’s guides on same-store sales growth and building a team that drives growth.
- Franchise performance benchmarks from 330 brands — Franchise Business Review
- Franchise performance benchmarks by industry — VetMyFranchise